

A week into October, a US jobs report came out indicating a drop in unemployment as well as steady wage growth. This was expected to encourage the US Federal Reserve to continue on their hawkish path, since it showed evidence of a healthy economy. Fed rate hikes would normally be called into question signs of economic weakness, not strength. Coming off the news, Bitcoin prices lost 3.6%, Ether was down 3.4%, and altcoins like Solana and Avalanche were also in the red. “The jobs report was bearish for crypto and stocks,”, explained MarcusSotirou of GlobalBlock, “as the data came in hotter than expected”. This was merely the latest in a long series of beatings taken Bitcoin at the hands of the tight monetary environment introduced the Fed since March.
After the completion of Ethereum’s Merge to a proof-of-stake system on September 15th, Ether prices displayed a downward bend, generally hovering in the region of $1,300, but falling to $1,200 on October 2nd. People were waiting to see evidence of the new system’s functionality and also of company adoption. Still, the relative stability of prices in the latter part of September and start of October was noteworthy because stocks were spiralling downward. Some analysts thought it could be proof that the correlation between crypto prices and stocks was breaking down, but this remained unconfirmed. Rolling into the final quarter of the year, there still seemed to be plenty of reasons Ether prices could run into volatility: Fed meetings, inflation reports, midterm elections.
In the arena of CFD crypto trading, emotions like enthusiasm and greed are not what guide decision-making. Rather, this is done through thoroughly researched techniques that fall under the bracket of technical analysis. Information on historical price activity is packed into an easy-to-read format on charts, which technical analysts spend their time poring over, searching for known patterns. This helps them identify trends in the crypto market that are imperceptible to the naked eye, and could help them decide whether to open a Buy or Sell CFD trading deal. But don’t worry if terms like ‘technical analysis’ make you nervous—we’ll take you through the basics in an easy-to-understand format.
Short Intro
Technical analysts assume that price movements for a security are not orderless and random, but actually obey the rules and patterns that apply in all times. They mostly ignore the information reflecting fundamental factors like the sales, earnings, and management of a company (elements which are, however, used those employing fundamental analysis). Instead, they focus on price activity because they believe it has already absorbed all the fundamental data, in addition to the key factor of market sentiment. From the price data, they weave technical indicators like moving averages, trendlines, and momentum indicators. These are used – never with scientific accuracy, but only with various levels of probability – to understand what the market trend is, and when it might be expected to change.
Some Examples
If you worked out theaverage price for a crypto over a period of time, you could derive a Moving Average, which could be either simple or exponential. This powerful indicator gives you a picture of underlying trends in the market, and can assist in determining a good time to open your trade.
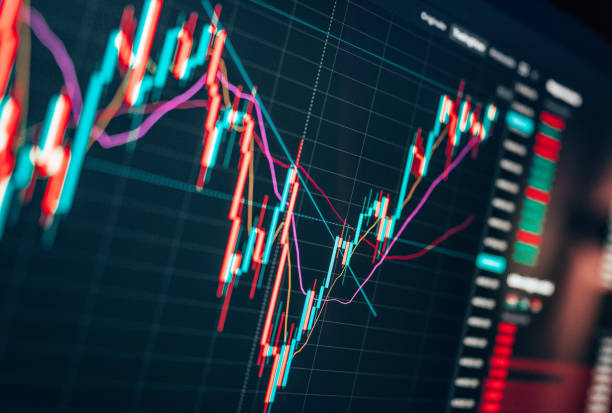
Candlestick Charts are well-loved crypto traders because they pack a lot of relevant information into a small visual space. The candlestick shows what happened to the crypto’s price in the time period of your choice, whether it be five hours or five minutes. If your candle is red, it means prices started at the top of the candle and ended at the bottom. If it’s green, it means the opposite: Prices ended higher than they started. The wicks tell you the high and low point for the period. An RSI (Relative Strength Index) can unearth the critical status of a crypto as either overbought or oversold. When analysts see the RSI for a crypto is under 30, they conclude it’s oversold and that, consequently, it could be a good time to open a Buy deal. When the RSI is over 70, the crypto is overbought and could opt to open a Sell deal.
Bollinger Bands do the same thing adding or subtracting a standard deviation from the moving average. When the market price is above the Bollinger Band, the crypto is overbought; if it’s below, the crypto is oversold.
Wrapping Up
Those who have been in the business of CFD crypto trading for a while know that the tools of technical analysis are not relied upon exclusively. Rather, they are incorporated into your overall trading strategy. Not every trader relies on them with equal strength either, and there’s no rule in this regard.
It’s also important to be aware that these tools are fallible. Although it seems to be true that historical buying and selling patterns repeat themselves, it’s hard to know which pattern will reappear at which time, and whether or not it will reappear in exactly the same way. The general consensus is that technical analysis is a powerful tool that may provide you withinsight on underlying price trends, when used properly and with overall common sense, but they’re never a guarantee.